ntsc-crt
Signal-level NTSC: the composite waveform itself, encoded from three sources, pulled apart by four different filters, and displayed through a five-stage CRT model, with a check that can fail at every stage.
The 6502 work simulates a chip at its switches. This simulates the signal between a console and a tube: the composite waveform itself, twelve samples per colour subcarrier cycle, on a grid whose rate is held as the exact rational 12 x 315/88 MHz and never as a float. The two projects meet at the NES: the engine ladder’s machine emits dots, and this turns dots into a waveform and the waveform into phosphor.
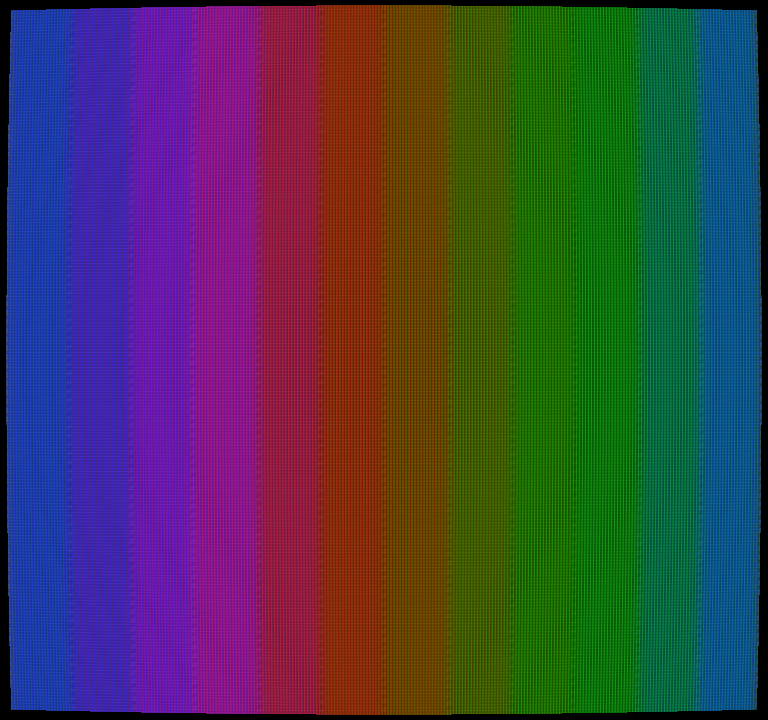
Every stage is checked against something real, and every check can fail
Three sources converge on one waveform type. A NES dot stream is encoded the way the PPU encodes, with levels from a double-checked transcription of the measured voltage table. Any RGB framebuffer goes through a broadcast encoder held to SMPTE ST 170M’s own clauses, down to the published colour-bar levels. A captured waveform is the one source that must earn its phase: it locks to sync and burst, and is proven by a roundtrip through a modelled capture card that finds an injected 50 ppm rate error to within 5.
Decoding means pulling colour and brightness back apart, and there are four ways to do it here, each verified separately. The notch filter is what a cheap 1980s set did. The two-line comb is refused outright on the NES signal: adjacent lines sit 120 degrees apart, so they cannot cancel, and asking for it is an error with an explanation rather than a quietly worse picture. The three-line comb is the one that fits the NES, three lines whose colour phases cancel exactly. The temporal comb, which averages whole frames, is the one the spec got wrong, below.
The CRT is a model and says so: beam, scanlines, phosphor persistence, mask and geometry, every parameter chosen by hand and labelled that way, held by analytic tests because there is nothing real left to compare a model against. And the whole tree runs its suite once more with MUTATE=1, which deliberately corrupts filter coefficients and level tables: 33 tests must go red, because a check that cannot fail is not a check.
Three of the spec's own numbers did not survive measurement
The spec this project was built from declared every one of its pre-computed numbers a claim for a test to confirm. Three of them failed, and each correction now sits in the current spec beside the test that forced it.
- The famous 60.0988 Hz is real but belongs to a different quantity. Full NES frames measure 60.09848 Hz exactly; 60.09881 Hz is the two-frame average with the short frame alternating in, the rate a player actually sees. Each of the three NES rates is now pinned by its own test, so the two can no longer be conflated.
- The specced temporal comb cannot exist. The spec said rendering-enabled frames sit 180 degrees apart, so averaging two frames cancels chroma. The residues its own geometry section states are 120 and 240 degrees, and the measurement agrees: a two-frame average only attenuates. Three full frames cancel exactly, and that is the comb that shipped.
- The classic bandwidths are a historical note, not the standard. Y to 4.2 MHz, I to 1.3, Q to 0.4 is what everyone quotes. The primary standard, in hand and pinned by hash, leaves Y unrestricted and makes the colour-difference channels equiband; the split I/Q figures are its own NTSC-1953 continuation note.
The reference material is pinned by hash, and every disagreement has a name
The NES pipeline is compared against blargg’s nes_ntsc 0.2.2, recovered from the Wayback Machine’s capture of a dead canonical URL and pinned by hash; it is test rig only, LGPL, and never shipped. Where the two pipelines disagree, the difference is attributed to a specific stage with a test rather than absorbed into a tolerance: the level rounding is his, the emphasis approximation is his, the decoder matrix and gamma are legitimately both, and the consolidated table names each with its magnitude.
The broadcast encoder is held to SMPTE ST 170M-2004 itself, fetched from SMPTE’s repository and pinned by hash, down to re-deriving the published colour-bar column from the standard’s own clauses. The NES level table was accepted only after two independent transcriptions of the same wiki revision agreed on all 43 numeric values.
A real console reached the pipeline before the colour bars did
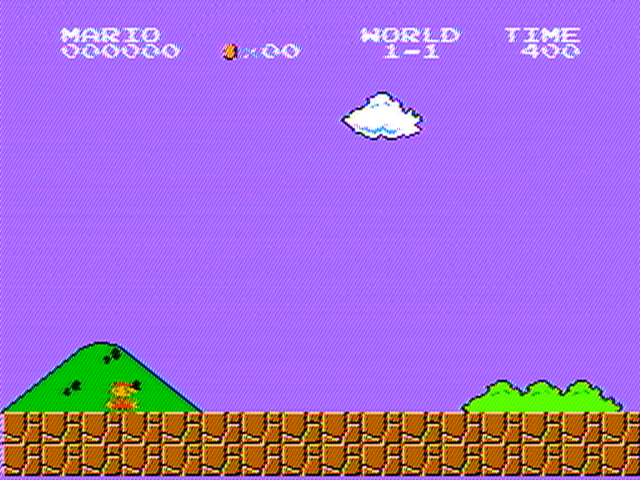
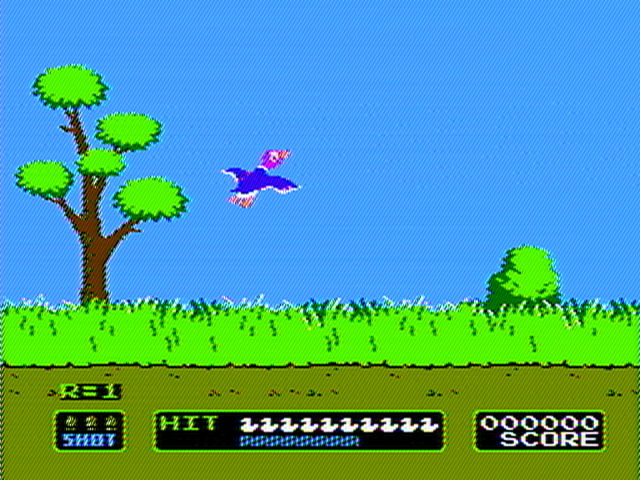
On 2026-09-02 a front-loader NES and a Super Mario Bros. / Duck Hunt cartridge met the family’s oscilloscope: 5 raw composite records, twelve million samples each at 125 MSa/s, captured straight off the video pin with no capture card and no decoder chip in the path. Everything below was measured from those records by the repository’s own recovery.
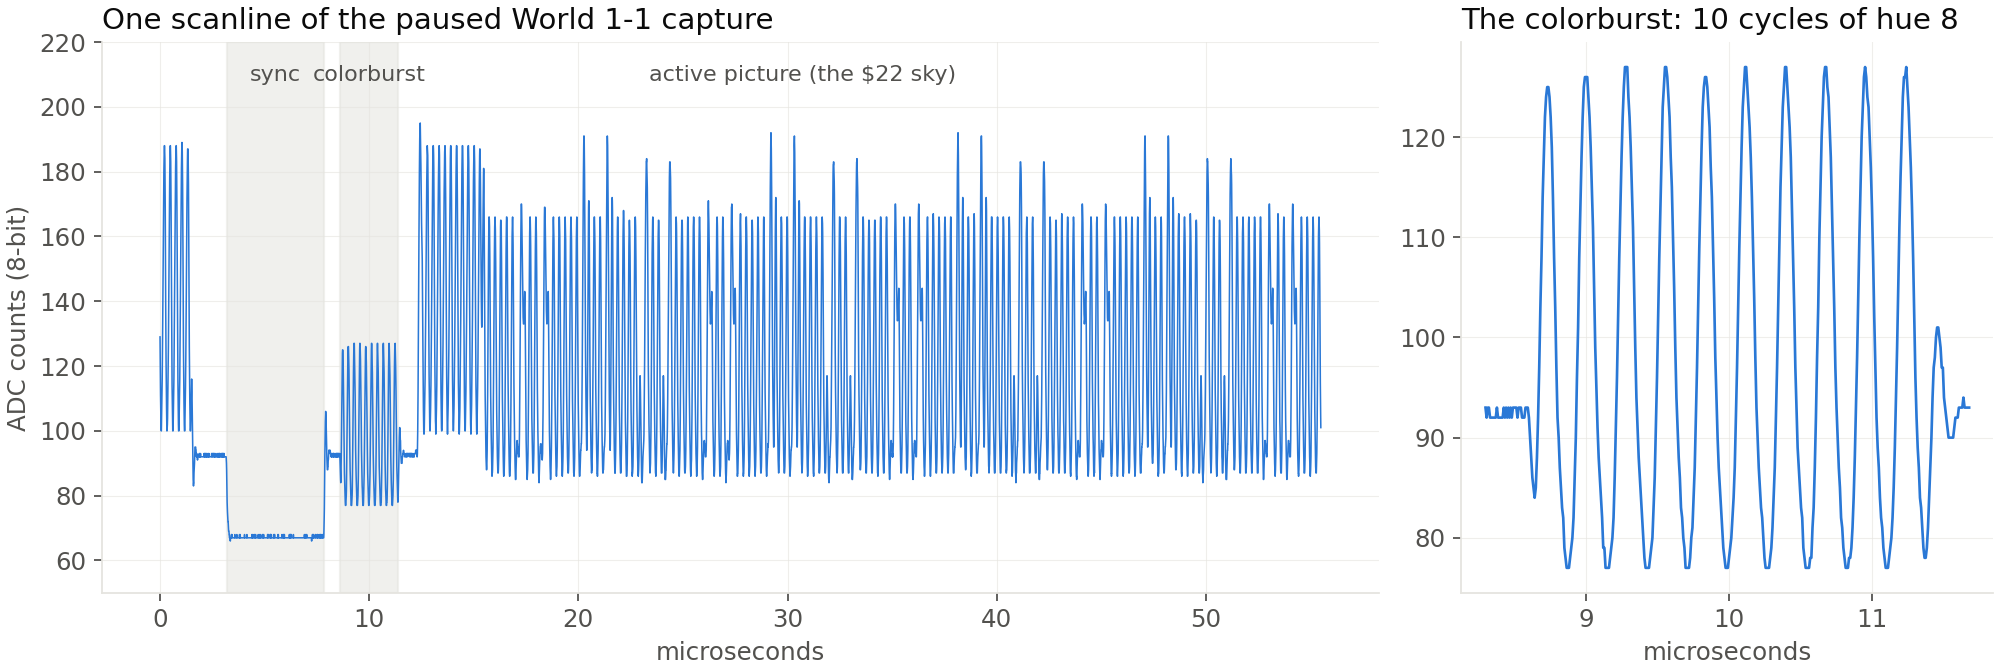
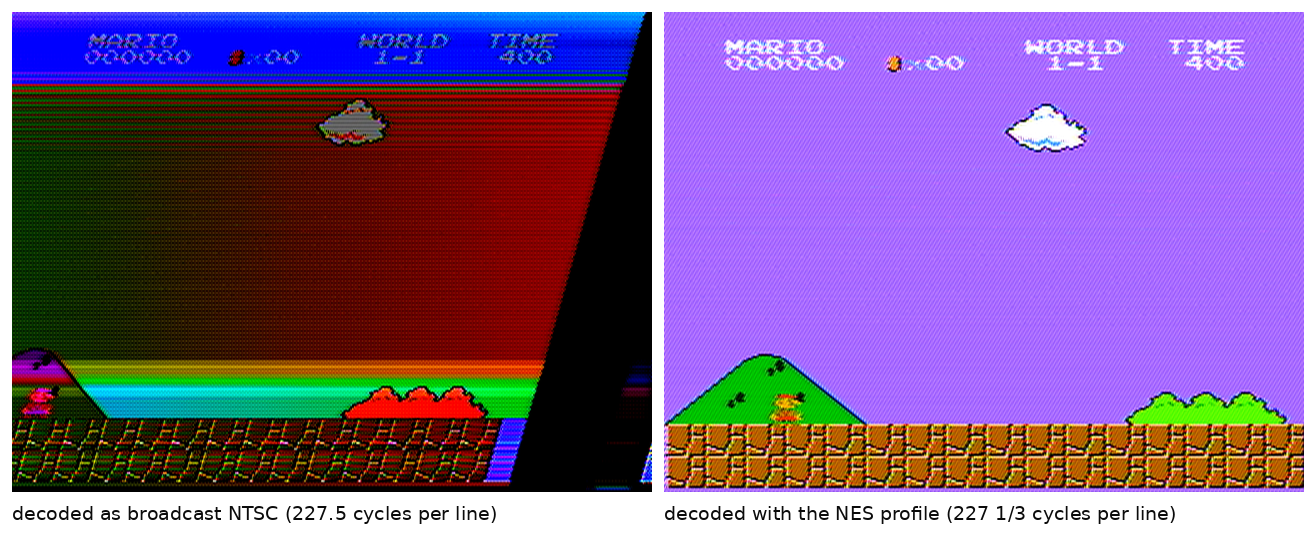
The first decode came out wrong in an instructive way. The recovery assumed broadcast geometry, and the NES is not broadcast: its line is 227 and a third subcarrier cycles (2728 grid samples where broadcast has 2730), so the burst phase advances a third of a cycle per line, not half. Decoded under the wrong model, every line landed slightly more hue-rotated than the last, a smooth colour roll down the whole frame, and the same two-sample bias mismeasured the scope’s clock at 733 ppm slow. Under the NES profile the identical records measure -7 to -19 ppm. The fix, recover_nes, is proven on a synthetic NES capture, and the test’s built-in sabotage is the broadcast assumption itself: the exact mistake the real console exposed, kept in the suite so it cannot come back.
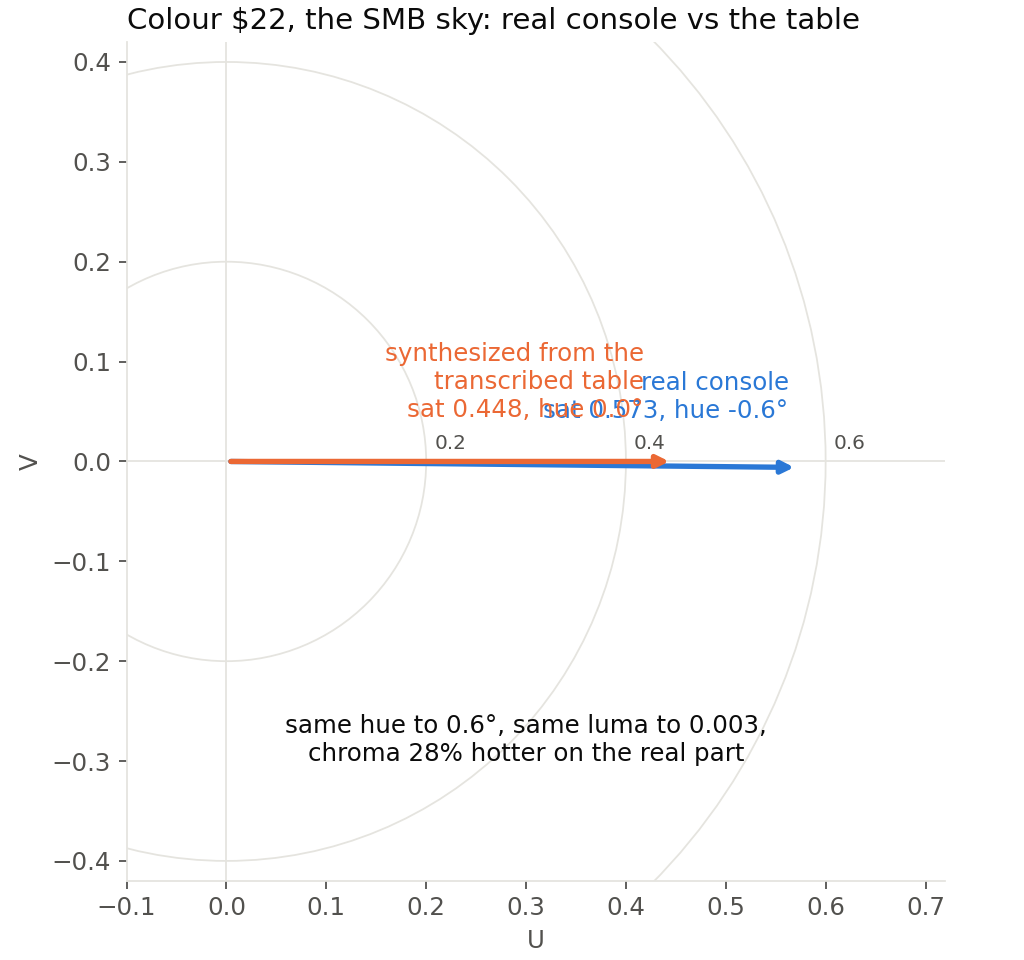
With the geometry right, the sky in paused World 1-1 became the first real region scored against the family’s own synthesis: the same colour, $22, generated from the transcribed level table and decoded through the identical path. Luma agrees within 0.003 and hue within 0.6 degrees. Saturation does not: the real console’s chroma measures 28 percent hotter (0.573 against 0.448). That gap is a real finding, and widening a tolerance to hide it would defeat the point. Either the unterminated probe run flatters the chroma swing, or the real DAC’s AC swing genuinely exceeds the table’s DC-measured levels, and one 75 ohm terminated re-capture decides which.
Every number here comes from re-running the tests
The story above comes from the repository’s milestone reports, but the figures below are not copied out of them: on 2026-09-04 we ran the project’s own scanner, its full test suite and its MUTATE=1 run again at the recorded commit, and this page reads only what that run wrote.
The bench runs the pipeline live
The live bench runs this pipeline in the page, NES dots in and decoded pixels out, with the drift counters visible. In the browser it measures at least 41.5 frames a second on the notch filter and 44.4 on the three-line comb (perf-report run 2026-09-02, wasm+simd128 (the shipped bundle), node v24, Ryzen 5 5600X, low end of the spread over three fresh processes): near the source’s own 60.09881 Hz, and the bench prints the rate it actually achieves rather than a promise.
What is not here yet
- The colour-bars half of the real-recording check is still open. Real console captures now decode end to end, but the check wants the seven standard colour bars at 75 percent, and a game cartridge does not draw those; it waits on a test ROM. The instructions are one page.
- The saturation question above had a designed experiment waiting, and it has run: the same console through a 75 ohm feedthrough terminator, which separates the probe run’s flattery from the DAC’s own behaviour. The composite deep-dive reads the terminated signal off the scope, level by level.
- The levers that made it fast, decimation before the chroma lowpass and convolutions restructured for the vectorizer, were named in the M2 report before being built, and every locked-down comparison against the references still passed through the change: the speed came from the same commit the figures above were re-verified at.
The repository is public and MIT: github.com/tinymachines/ntsc-crt. Unlike the 6502 tree it has no licence boundary inside it: it embeds no die data, and the one LGPL piece is the native test oracle, which no shipped artefact contains.