Composite, terminated
Composite video is one wire carrying everything: where each line starts, where the colour clock is, and the picture itself, all as voltage against time. This page reads that wire from a real front-loader NES, terminated into the 75 ohms it was built to drive, sampled at 125 million points a second with nothing but a scope in the path. Every number below was measured from the record by the repository’s own tool at the recorded commit; the drawings are that tool’s, not illustrations.
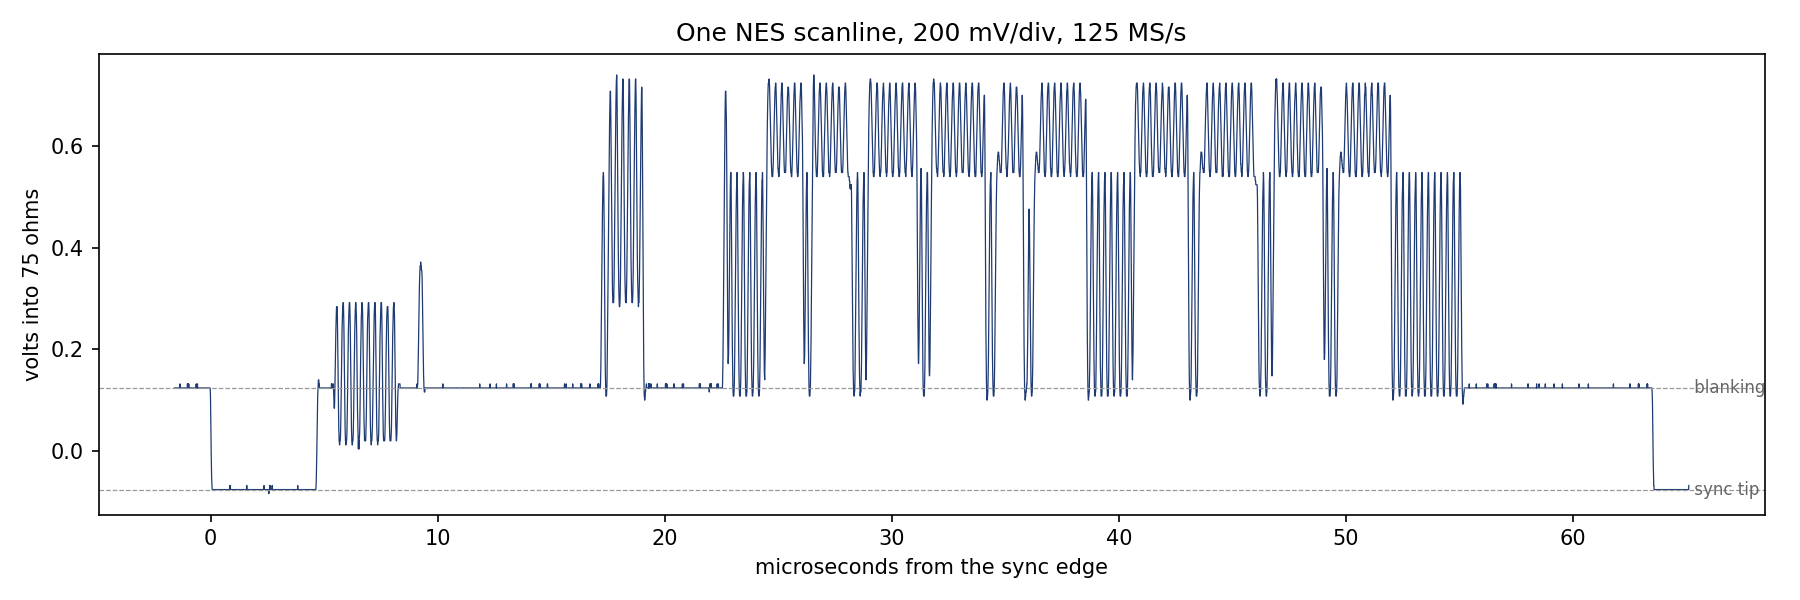
One line, as the ADC saw it
A line begins with sync: the signal drops to its lowest level, -0.076 V here, and holds it for 4.7 microseconds. It returns to blanking, 0.124 V, a step of 0.200 V that every decoder uses as its ruler. Then the burst, then the picture, then blanking again until the next sync. Across the 1512 lines in this record the syncs arrive 63.512 microseconds apart. Broadcast NTSC says a line is 227 and a half subcarrier cycles, 63.556 microseconds; the NES draws 227 and a third, 63.509, and the record says so to the third decimal. That difference is the one the landing page’s first decode tripped over.
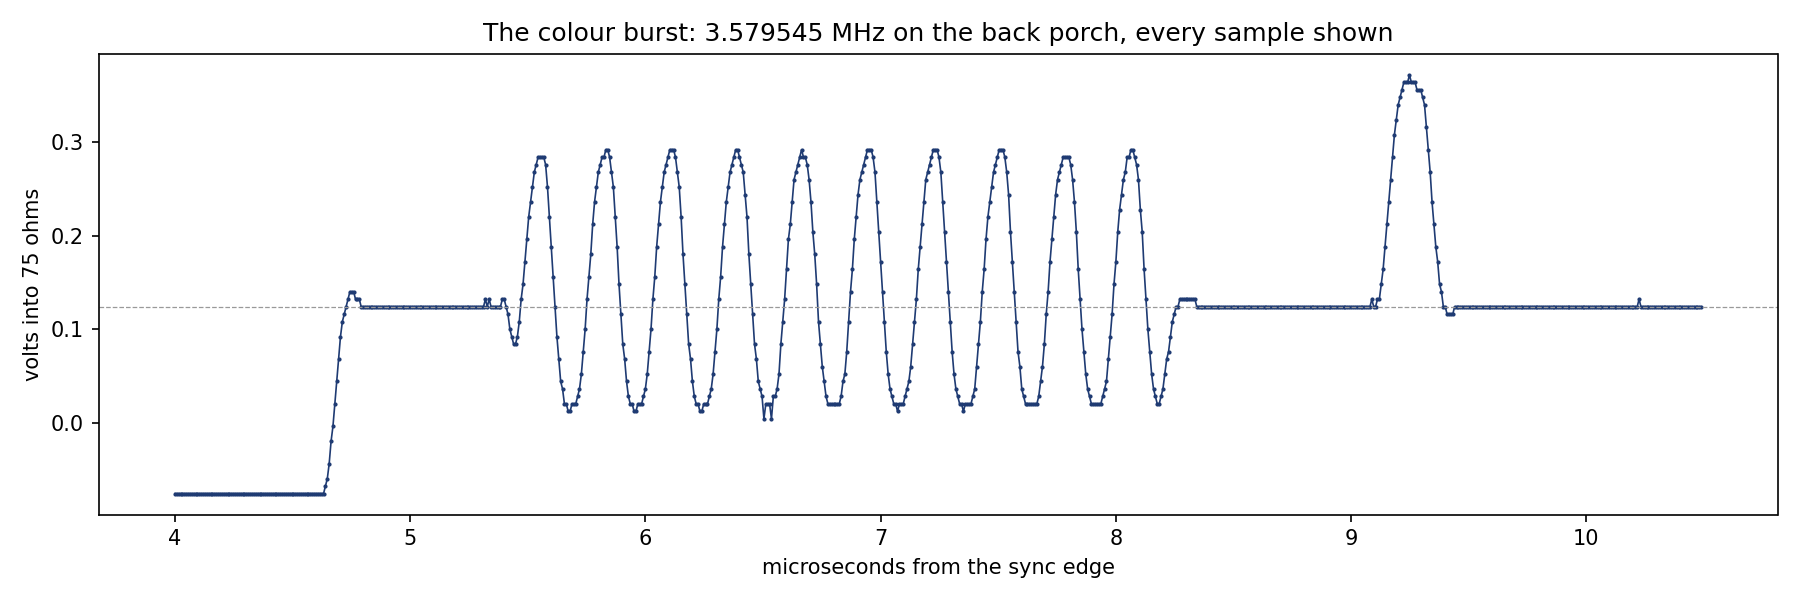
The burst
Eight microseconds in, on the back porch, the console sends about nine cycles of its colour subcarrier, 3.579545 MHz, with nothing modulated on them. This is the burst: the reference the receiver locks its own oscillator to, so that the phase of the chroma in the picture means a hue. At this sample rate a cycle is 34.9 samples wide, so every dot in the drawing is a real sample. It swings 0.280 V peak to peak, and it does so on every line of the record to the millivolt. Divided by the sync-to-blanking step that is a ratio of 1.40; the transcribed level table, measured on a different console into 75 ohms, gives 1.42.
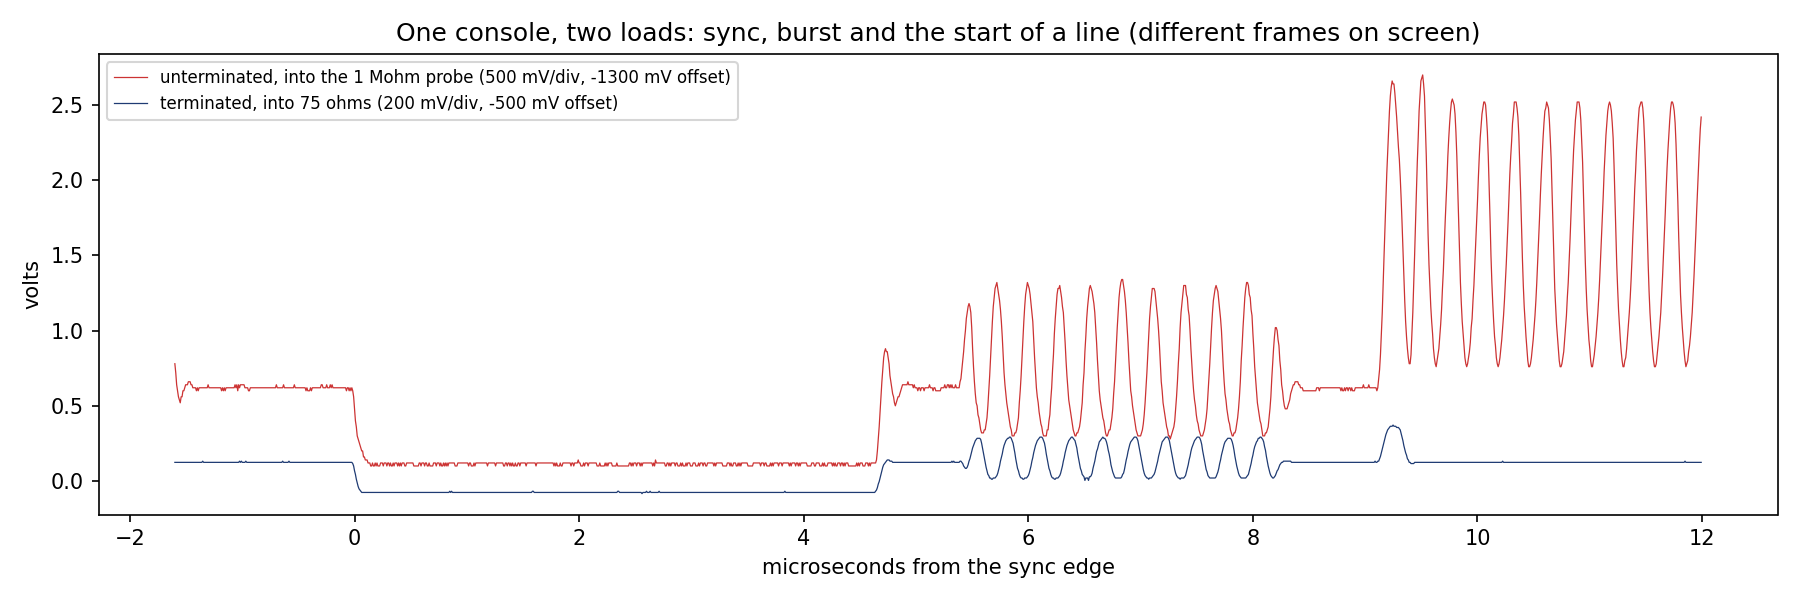
Why the terminator
The landing page’s first captures were taken with the probe alone: a 1 megohm input on a signal designed for 75 ohms. The overlay puts one line of that record over one line of this one. Unterminated, the sync-to-blanking step came up 2.50 times larger. The burst came up 3.57 times larger. Those are not the same number, and the difference is the whole story: the DC levels scaled one way and the 3.58 MHz subcarrier another, so the unterminated record carried a burst-to-sync ratio of 2.00 where the terminated one carries 1.40 and the table 1.42. A decoder that takes the sync step as its ruler, which is what decoders do, saw the colour about 40 percent too strong before its own filtering, and after it the landing page reported the sky of World 1-1 decoding 28 percent hotter than its synthesis. That was the probe, not the console.
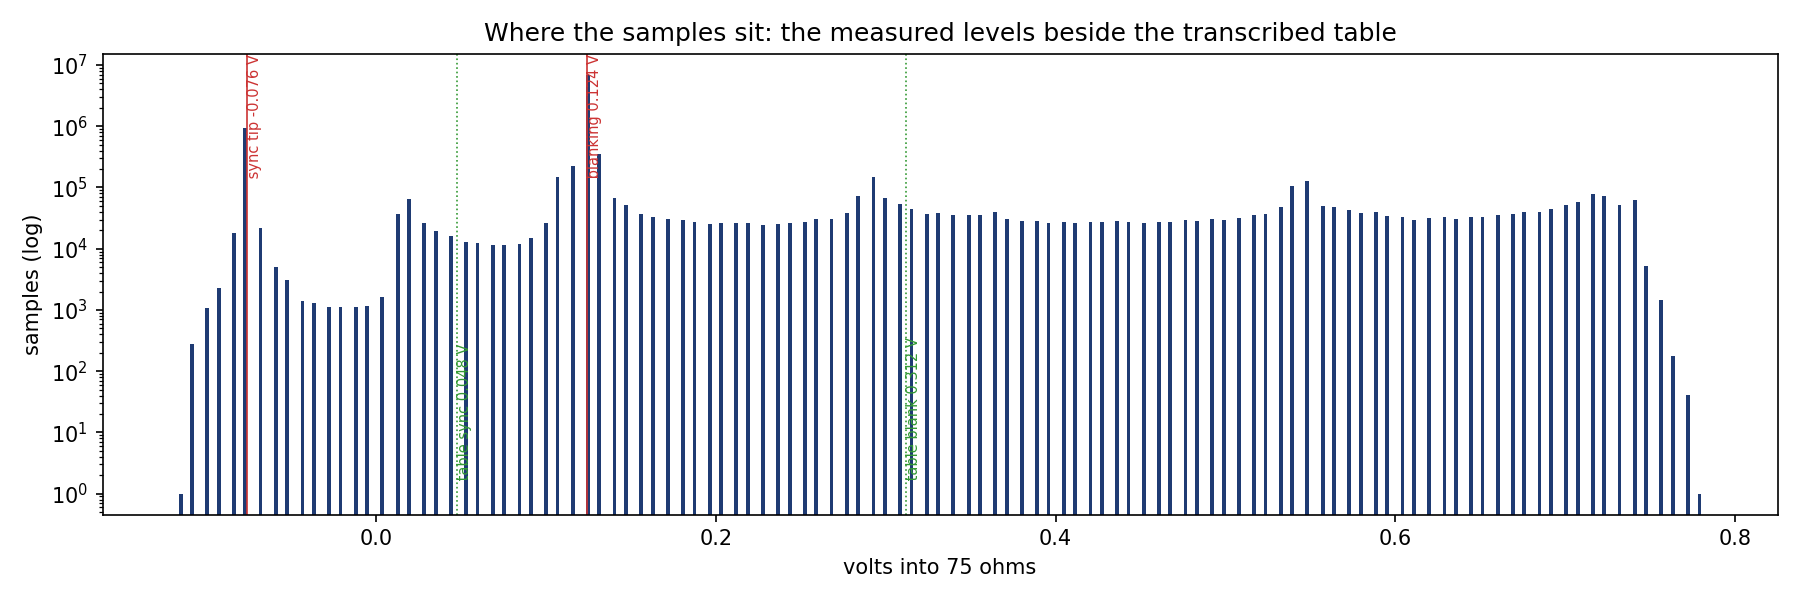
The levels beside the table
This console’s absolute levels sit below the table’s: a sync-to-blanking step of 0.200 V against 0.264, and a sync tip at -0.076 V, below zero, where the table’s console put it above. Consoles differ in their output stage and the table was measured on one of them; what a decoder needs is not the volts but the ratios, and the recovery in the repository normalises every record onto the table’s sync and blanking before it looks at anything else. On that ruler the terminated burst agrees with the table within 2 percent.
What the decode makes of it
This frame is the terminated record run end to end through the repository’s recovery, which finds the sync, locks to the burst, resamples onto the NES grid, and pulls colour and brightness back apart. The cartridge menu was on screen. The frame is Nintendo’s, reproduced for commentary on the measurement.

Where the numbers come from
m4-report third addendum, 2026-09-04: the same console into a 75 ohm feedthrough terminator, CH3 DC 200 mV/div, 12 Mpt at 125 MSa/s, the cartridge menu on screen, measured by tools/composite-figures.py. The page reads the record as it was committed at bb310f5, and nothing on it is typed.
What is not here yet
The terminated sky. The landing page’s saturation finding was scored on the paused World 1-1 sky, and the confirmation is that same region through the same scorer from a terminated record. The console needs its Mario paused again; when it is, the number will land here the way every other number on this page did, measured and committed, not from memory. Back to the NTSC landing.