Using an oscilloscope, for software developers
Printable: Using an oscilloscope, for software developers (PDF).
2026-10-07
Your logs stop at the pin
An oscilloscope is a debugger for the wire. Your code can tell you what the chip saw; only a scope can tell you what was actually there. When the two disagree, every hour spent reading code is an hour spent on the wrong side of the pin.
The example running through this article is real. A Geiger counter board (a CAJOE RadiationD) clicks audibly with a source on its tube. Its pulse leaves through an optocoupler and lands on GPIO18 of an ESP32-C6, which timestamps each edge to 6.25 ns and streams them to a server as random bits. The counter clicked. The firmware counted zero.
We did what software people do first: we wrote a smaller program. A diagnostic firmware printed the pin's level and a count of falling edges once a second. It proved the pin worked (a jumper to ground read level=0) and that nothing ever arrived from the opto (falls=0, always). That narrowed the fault to a few centimetres of wire and two small boards. It could not say which centimetre. The program can only see the end of the chain, and the fault is somewhere upstream of it.
That is the moment to reach for a scope.
A scope is a print statement for voltage
A scope plots voltage (up) against time (across), over and over. Everything on the front panel maps to an idea you already have.
| Scope control | What it is, in software terms |
|---|---|
| Channel (CH1 to CH4 on a four-channel scope) | One variable being logged. Each has its own probe |
| Volts per division | The y-axis scale. 2 V/div across 8 divisions shows 16 V |
| Time per division (timebase) | The x-axis scale. 50 us/div across 12 divisions is a 600 us window |
| Offset and position | Where zero sits on screen; where the trigger sits in the window |
| Trigger | A conditional breakpoint: "start recording when CH1 falls through 2.5 V" |
| Memory depth | How many samples the buffer holds. Deep memory lets you zoom in after the fact |
| Coupling (DC or AC) | DC shows the true level; AC strips the average, which hides a stuck-high line |
Two habits carry over from debugging code. First, know what you expect before you look. Write it down: "P3's VIN pin idles near 5 V and drops to near 0 V for about 100 us per click". A trace you have no prediction for is just a picture. Second, change one thing per capture. Move one probe, take one shot, compare.
The ground clip is wired to the building
The one thing to learn before touching a probe: on a mains-powered bench scope, every probe's ground clip is connected to earth, through the scope's power cord. All the ground clips are also connected to each other. A clip is not a passive reference; it is a wire to the wall.
That has three consequences:
- Clip ground to ground only. A ground clip touched to a 5 V pin shorts that supply to earth. On our NES bench, the controller connector's pin 1 is the supply; a clip on it would short the console's rail.
- Every clip on the bench shares one ground. With CH2 to CH4 already on the NES, clipping CH1 to the Geiger board's ground ties the Geiger board's ground to the NES's. For a test that is fine. It also means that while the probe is on, you cannot measure whether the two sides were isolated.
- Know where the high voltage is. A Geiger board makes about 400 V for its tube. The low-voltage header (P3) is safe to probe; the tube end is not. Find the hot end of any board before you bring a probe near it.
Then check the probe's ratio. Most probes have a 1x/10x switch, and the scope has a matching setting per channel. If they disagree, every reading is off by ten. On this bench the scope was set to 10x with 1x probes, and a 5 V rail read 50 V on screen. Set both, and check them against a known voltage (the board's 3.3 V or 5 V pin) before trusting anything else.
1x gives a smaller, cleaner trace at low voltages. 10x loads the circuit less and is the right choice for fast edges.
The trigger is a conditional breakpoint
A Geiger pulse is about 100 us wide, and with a source on the tube it comes roughly ten times a second, at random. Without a trigger, the scope redraws a 600 us window thousands of times a second and the pulse flashes past too fast to see. The trigger tells the scope which moment to put in the middle of the screen.
An edge trigger has three settings:
- Source: which channel to watch (CH1).
- Level: the voltage to cross (2.5 V, halfway between a 5 V idle and 0 V).
- Slope: which way to cross it (falling, because the pulse pulls the line low).
The sweep mode decides what happens while nothing matches:
| Sweep | Behaviour | Use it when |
|---|---|---|
| Auto | Triggers on the event, or on a timer if none comes | Finding a signal at all; a flat line still draws |
| Normal | Draws only on a real trigger, keeps the last one on screen | Rare or random events |
| Single | Waits for one trigger, captures, then stops | Taking one capture to keep or read from a script |
The trap with Auto: a line that never moves still draws, so it looks like a healthy flat signal. If you are waiting for an event, use Normal or Single. Then a dark screen means the event never happened, and that is a result.
Size the window to the event. To see a 100 us pulse, 50 us/div puts it across two divisions. To count ten pulses a second, zoom out to 100 ms/div so a 1.2 s window catches about a dozen.
Bisect the signal chain like a commit range
A signal chain is a sequence of hops, and a missing edge was lost at exactly one of them. Finding it is git bisect with a probe: look at a point in the middle, and the answer throws away half the chain.
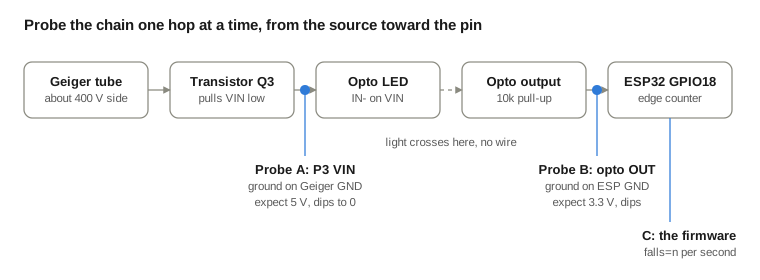
The firmware is point C, and it said zero. The cheapest next look is point A, the Geiger board's own output, because it splits the chain at the isolation barrier:
- A dips about ten times a second: the counter is fine. Move the probe to B.
- A never moves: the fault is on the Geiger board's side. Here that most likely means the wire is on the wrong pin of P3, whose pin order had only been read off photographs.
- A dips and B does not: the optocoupler, or its wiring, is the fault.
- B dips and C still counts zero: the fault is between the opto and the chip, or in the code.
Each probe point has its own ground. A is measured against the Geiger board's ground, and B against the ESP's ground, because the optocoupler exists to keep those two apart.
We had already tried to reason past this step. The guesses (swap two wires, short two pins, tap a ground) each cost a round trip to the bench and could not tell us where the edge was lost. One probe on A answers that in a single capture.
The scope has an API
Most bench scopes made in the last fifteen years speak SCPI (Standard Commands for Programmable Instruments): plain-text commands over a TCP socket, usually port 5555 on a Rigol. A command ending in ? returns one line. That makes the scope scriptable from anything that can open a socket.
import socket

s = socket.create_connection((SCOPE, 5555), timeout=5)

def q(cmd):
    s.sendall((cmd + "\n").encode())
    if not cmd.split()[0].endswith("?"):
        return None
    buf = b""
    while not buf.endswith(b"\n"):
        buf += s.recv(4096)
    return buf.decode().strip()

print(q("*IDN?"))                      # maker, model, serial, firmware
q(":CHAN1:PROB 1")                     # match the probe's 1x switch
q(":CHAN1:SCAL 2")                     # 2 V/div
q(":TIM:SCAL 50e-6")                   # 50 us/div
q(":TRIG:EDG:SOUR CHAN1")
q(":TRIG:EDG:SLOP NEG")                # falling
q(":TRIG:EDG:LEV 2.5")
q(":SING")                             # arm one capture
print(q(":TRIG:STAT?"))                # WAIT until it fires, then STOP
print(q(":MEAS:ITEM? VMIN,CHAN1"))     # the dip's floor, in volts
The first query we sent to this bench's DS1054Z read back all four channels' state before a probe moved. It showed CH1 flat at about 0 V while CH2 and CH4 toggled at 60 Hz with the NES's controller reads, so CH1 was the channel free to borrow.
What a script gets you:
- Measurements as numbers.
VMAX,VMINandFREQper channel, without reading a graticule. - A screenshot as a PNG.
:DISPlay:DATA? ON,OFF,PNGreturns what the screen shows, so the capture goes into the bug report. - The same capture every time. A test that arms the scope, triggers the circuit and checks the result can run unattended.
The traps we hit on this bench:
| Trap | What it looked like | What to do |
|---|---|---|
| The front panel locks | Knobs stop working after a script connects | Press the scope's Local (Force) key |
| One client at a time | A second script hangs or reads another's replies | One owner per session; close the socket |
| A stale reply in the buffer | A screenshot's PNG header was preceded by OP from an earlier status query | Drain the socket before each command |
| Probe ratio | 5 V read as 50 V | Set :CHANn:PROB in the script itself |
| Waveform reads | :WAVeform:DATA? came back empty or flat on this firmware | Trust measurements and screenshots first |
| No external trigger input | The DS1054Z refused EXT as a source | Spend a channel on the trigger signal |
| Leaving it changed | The next person finds a single-shot, odd-scaled scope | Put back RUN, AUTO and the old trigger when done |
The instrument can be wrong too
A scope trace is evidence, not truth. Every wrong conclusion on this bench came from an instrument that was set up wrong, not from the circuit:
- The jumper that wasn't on the pin. A ground wire held on the header pin labelled "18" never changed the firmware's reading, which looked like a dead pin. A test pulse driven from inside the chip was captured fine, so the pin worked and the wire was somewhere else. Prove the probe point before you believe its silence.
- The test that tested nothing. We suggested shorting the opto's two input pins to fake a click. Shorting the LED's two leads turns it off, so the test could never produce an edge. Ask what result a test would give if the thing under test were broken, and make sure it differs from what you'd see if it worked.
- The flat line in Auto mode. A channel with nothing on it still draws a tidy flat line. In Normal mode, nothing draws until the trigger fires.
Before every capture:
- Know what you expect to see, with numbers
- Ground clip on a ground, and you know which ground it ties to what
- Probe switch and channel ratio agree, checked against a known voltage
- Trigger source, level and slope match the event; Normal or Single for rare events
- Timebase sized to the event (to see it) or to the rate (to count it)
- One change since the last capture
- Scope put back the way you found it
Pulled at build time from geiger/docs/articles/oscilloscope-for-software-developers.md, a repository that is not public; this page is the public copy.